2. Working with a Running Installation
Most people meet OpenRVDAS already running on a ship. This section is the operator’s view — how to use the system through its web console, with no root access and no YAML. It is also the section to hand a new watchstander.
It assumes someone has already installed OpenRVDAS (section 3. Installation) and set up a cruise definition for the vessel (section 5. Setting Up Your Own Vessel). The screenshots use the NBP sample cruise that ships with OpenRVDAS — your vessel will have different loggers and mode names, but the controls are the same.
The Web Console
Point a browser at the OpenRVDAS machine — http://openrvdas, or
whatever your installation’s hostname is. You should see the console’s
cruise management page:
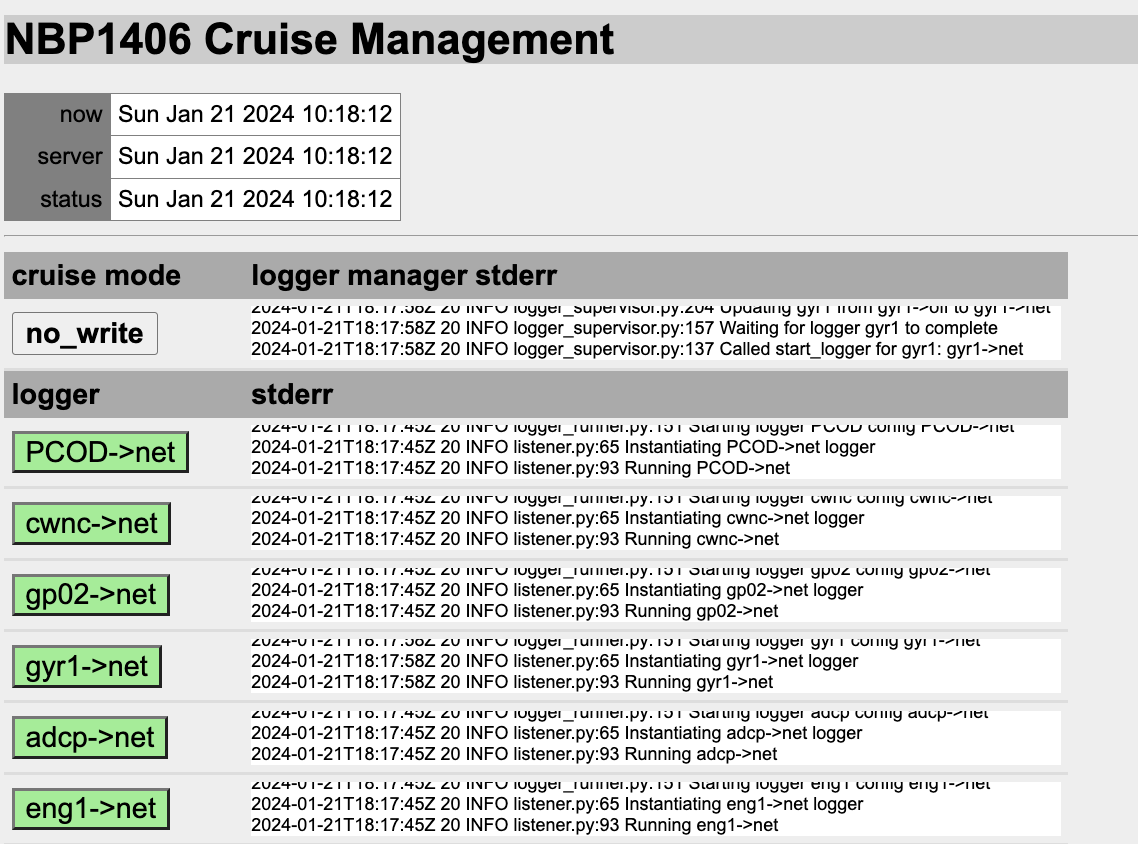
Your installation runs one of OpenRVDAS’s two consoles — Django or React (see How It Works). They look different but offer the same essential controls, and everything in this section applies to both; as throughout the Guide, screenshots are of the Django console.
Anyone can view the console; to change anything you must log in using
the link at the top of the page. On the Django console the account is
typically the OpenRVDAS user created at installation (rvdas on most
vessels); on the React console, accounts are managed from the console
itself by its admin user. If no cruise definition has been loaded yet,
logging in also gets you a “Load configuration file” button — more on
that below.
With a cruise definition loaded, the main page shows one row per logger.
Each row’s button names the logger configuration that logger is
currently in — gyr1->net, s330->off — and its color tells you how the
logger is doing:
- Green — running normally.
- Grey — not running, as intended. A logger in its
offconfiguration has nothing to do, and grey is its normal state. - Yellow — starting up. Loggers pass through yellow for a few seconds after a mode change; a logger that stays yellow deserves attention.
- Red — failing: the logger has crashed, or is being restarted repeatedly without success. See When Something Goes Red.
If every button turns red at once and the status timestamps at the top of the page stop updating, the console has lost contact with the server side — that’s a different problem from every logger failing simultaneously, and restarting loggers won’t fix it. See When Something Goes Red.
Starting and Stopping Loggers
In day-to-day operation you rarely touch individual loggers. Instead you
change the cruise mode: a mapping, defined in the cruise definition,
from each logger to the configuration it should be in when the ship is
in a particular situation. A typical vessel defines modes like off,
port, EEZ and underway — in port mode, for example, the weather
loggers might run while the Knudsen stays off. The NBP sample cruise
keeps it simpler:
off— every logger off.no_write— every logger reads its instrument and broadcasts the data on the network, but writes nothing to disk.write— asno_write, and the data is also written to logfiles.no_write+influxandwrite+influx— as above, with parsed values also sent to the InfluxDB database, if one is installed, for testing and display.
To change the mode, select the mode button at the top of the logger table (the one labeled “off” in the illustration below). A dialog will open with a dropdown of the modes the cruise definition offers (and a view of the logger manager’s recent stderr, useful when something misbehaves):
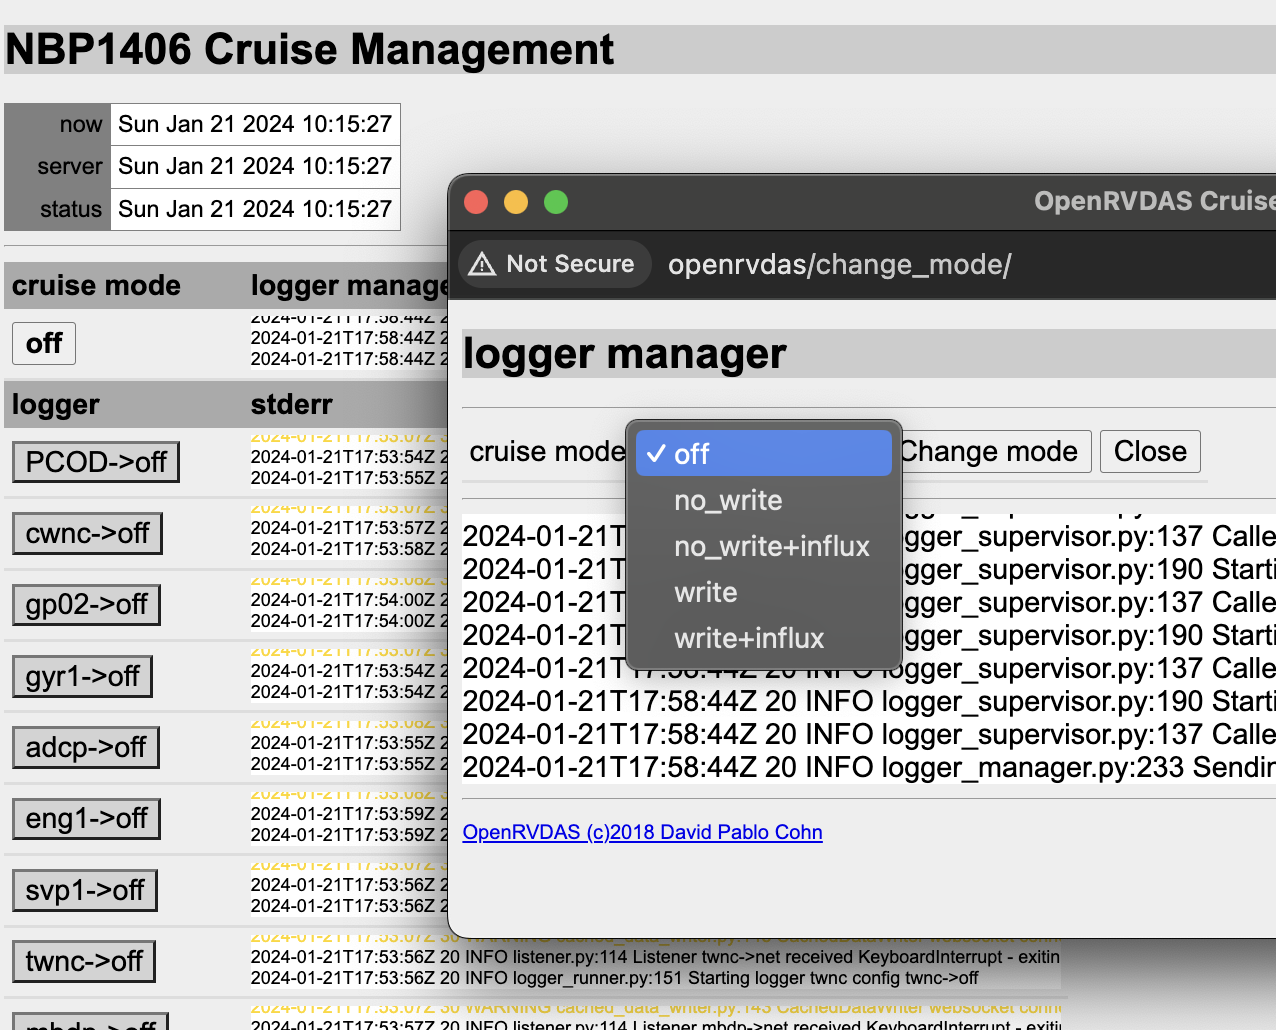
Choose a mode and press “Change mode”. Over the next few seconds each logger switches to its configuration for that mode, passing through yellow to green:
To change a single logger — say, to turn one noisy instrument off without disturbing the rest — select that logger’s configuration button. The dialog will show a dropdown of the configurations defined for that logger, the logger’s recent stderr output, and, at the bottom, the full definition of the selected configuration:
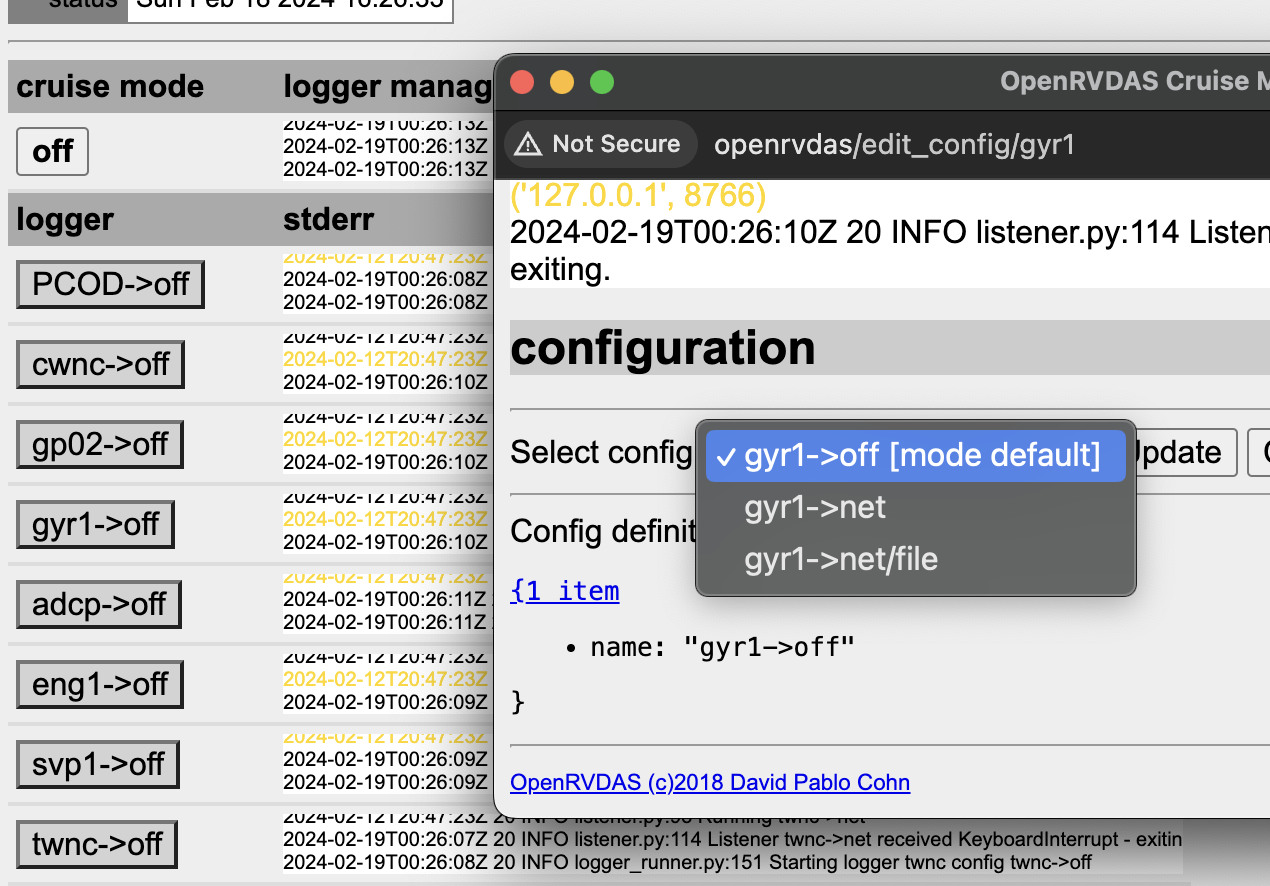
An individually set logger keeps its configuration until the next mode change, which puts every logger back into the configuration assigned for the chosen mode.
Loading a cruise definition is the one remaining control, and on
most vessels it happens once per cruise rather than once per watch.
After logging in, the “Load configuration file” button lets you choose
a cruise definition file; loading it populates the logger table and
puts the system in the definition’s default mode (off, for the sample
cruise). Everything the console displays — loggers, configurations,
modes — comes from this file.
If the source file for the cruise definition changes, the console will display a yellow button in the status section declaring “Definition is stale. Reload definition”. If a change to the file was expected, select the button; it will read in the updated cruise definition, altering the underlying configurations as appropriate.
Watching the Data: Displays
The console tells you whether loggers are running; it doesn’t show you the data they produce. For that, your installation may offer either or both of:
-
Grafana dashboards — the preferred route, if InfluxDB and Grafana are installed. These are typically served on port 3000 of the OpenRVDAS machine (
http://openrvdas:3000), and show live and historical plots of any parsed field.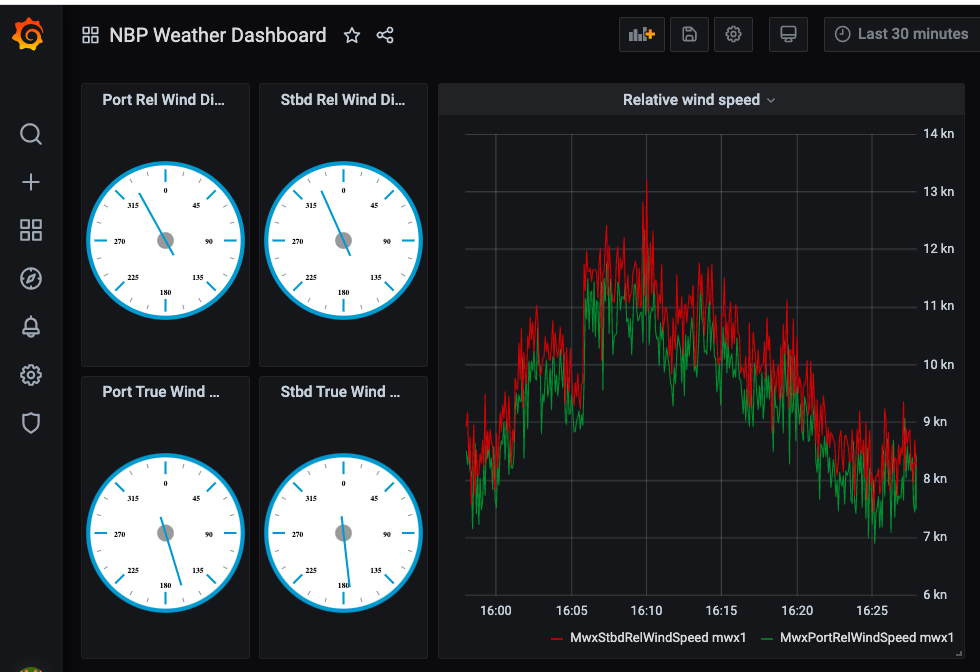
-
Built-in display widgets — web pages served by the console under
/display/. With the sample cruise running, tryhttp://openrvdas/display/nbp_dashboard.html: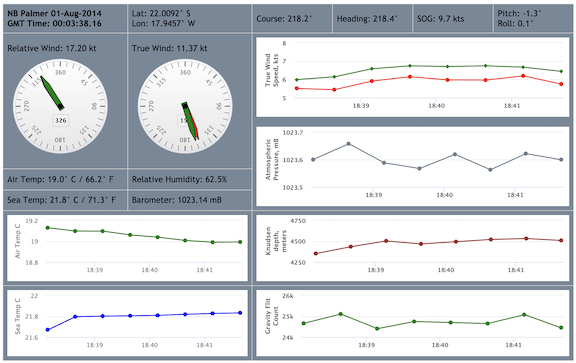
These widgets are fed live from the cached data server. They predate the Grafana route and are no longer the recommended one, but many vessels still use them.
Displays update only when loggers are running in a configuration that
feeds them — for the sample cruise, any mode other than off. A blank
display with green loggers usually means the system is in a mode that
isn’t sending parsed data; a mode with parsing (for Grafana, an
+influx mode) fixes it. Section
7. Storage, Displays and Distribution
covers building and modifying displays.
Sidebar: Advanced Data Snooping
If you also have terminal access on the OpenRVDAS machine as the OpenRVDAS user with the virtual environment activated, you can watch the data without any display at all:
-
Watch a logfile grow. In modes that write to file, each logger appends to its current logfile, so
tail -fwill show records as they arrive:tail -f /var/tmp/log/gyr1/raw/NBP1406_gyr1-$(date -u +%Y-%m-%d)(The above example uses the sample cruise’s path; your vessel’s cruise definition decides where logfiles live.)
-
Listen to the UDP broadcast. In the sample cruise configuration, and others following the recommended logger organization, every front-line logger broadcasts its records on UDP — port 6224 by convention — and
listenwill show you that stream, every instrument interleaved:listen --udp 6224 --write_file -One catch: only one process can be bound to the port at a time per machine, and in any active mode the
parse_datalogger already is. To listen in, you either need to temporarily setparse_datatooffin the console prior to listening, or listen from a different machine on the same network. Whileparse_datais off, raw logging will continue untouched, but the displays and database will stop updating — remember to set it back when you’re done.Note that different vessels may be configured to broadcast on different UDP ports, and some may use a different port for each logger; use the web console to open the logger you want to listen to and look for the port listed in its UDPWriter to be sure
-
Subscribe to parsed values by name. The least disruptive of the three: ask the cached data server for just the fields you care about, optionally using wildcards:
listen --cached_data S330\*,Gyr1HeadingTrue \
  --transform_to_json
Nothing needs stopping — the cached data server is built for many subscribers — and each new value prints as it arrives. Use the parsed field names, the same ones the displays use;
fields@host:portreaches a server on another machine.
Where the Data Ends Up
Data goes wherever your vessel’s cruise definition file tells the loggers to send it, but by convention, there are four places to look for it:
- Logfiles are the authoritative raw record. In modes that write to
file, each logger appends every record it reads — raw, as it came
from the instrument, plus a timestamp — to a file named for the
logger with the current date appended (
seap-2026-10-28), rolling over at midnight UTC, by default. Where those files live is set in the cruise definition; the sample cruise writes under/var/tmp/log/, but a typical live installation will write somewhere like /var/data/openrvdas. Consult your vessel’s documentation to find where you’re storing raw data. - As UDP packets, broadcast on the local network. The standard convention is, after storing raw data to disk, to broadcast timestamped and logger-tagged records via UDP on one or more ports, to be parsed and processed by other loggers. The default UDP port in the sample definition is 6224.
- The cached data server holds only the latest values of each field, in memory, to feed live displays and derived-data loggers. It is not storage: its contents are gone on restart, which is fine, because the logfiles and the database are the records.
- The database (InfluxDB, if installed) holds the parsed, named
fields —
S330HeadingTrue,MwxAirTemp— as time series, for Grafana and anything else that wants history.
When Something Goes Red
A red logger button means the logger is crashing: supervisor starts it, it dies, and after repeated failures the system gives up. First-line response, in order:
- Read its stderr. Select the logger’s configuration button; the dialog shows its recent stderr output, and the last few lines usually name the problem — a serial port that can’t be opened, a full disk, a typo in a changed configuration.
- Restart it. In the same dialog, re-select the configuration it should be in. If the cause was transient — an instrument that was power-cycled, a network blip — the logger will come back green and you’re done.
- Rule out the system-wide case. If every logger is red and the status timestamps at the top of the page are stale, the console has lost contact with the server side; individual loggers are probably fine. This needs someone with shell access — see 9. Troubleshooting.
- Write down what you saw for the person you escalate to: which logger, which configuration, when it went red, the tail of its stderr, and anything that changed around that time (a mode change, a definition reload, an instrument being serviced). A screenshot or two - taken on your phone, if necessary - may provide vital information to someone trying to debug remotely
A logger’s stderr also goes to disk, where it survives console
restarts: from v2.7.0, at /var/log/openrvdas/loggers/<logger>.stderr
(earlier versions wrote /var/log/openrvdas/<logger>.stderr). The
files rotate, so the history is there when you come back to it. The
deeper diagnostic path — isolating a failing pipeline stage with
listen, checking supervisor itself — is in
9. Troubleshooting.